
The holy grail of mobile marketing measurement is Return on Ad Spend (ROAS), particularly in this post-iOS 14.5 era when quantifying ROAS has become difficult for advertisers.
The calculation itself is straightforward. The cost must be aggregated and matched to attribution and income in order to calculate, and this is getting more difficult than ever.
Some of these concerns will be brought up in this blog article, along with other techniques to solve them. Let's examine it in detail.
Why is ROAS so challenging to quantify in a world that values privacy?
ROAS, Return On Advertising Spend, is a marketing metric that measures the efficacy of a digital advertising campaign. ROAS helps online businesses evaluate which methods are working and how they can improve future advertising efforts.
Due to the fragmentation of data among ad networks, advertisers have traditionally had a difficult time matching cost and attribution data.
Every ad network that the typical marketer uses has its own data scheme, business rules, business models, data refresh rate, etc. It has been challenging to standardize cost data and combine it with attribution due to the lack of standards.
SKAdNetwork (SKAN), privacy-centric attribution, web-to-app, and other forms of attribution evolved with the release of Apple iOS 14.5 and the ATT framework, causing additional data fragmentation. There are also additional data challenges as a result of the various attribution models.
What issues arise from the new forms of attribution?
Different levels of data granularity for the same ad network's cost and attribution.
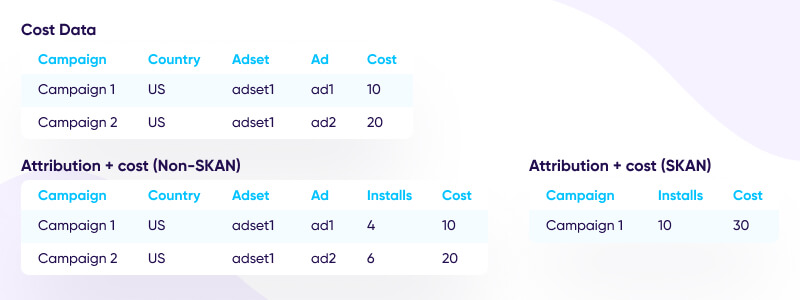
Network A, for instance, provides information on spending at the campaign, adset, ad, and county levels. However, Network A offers two distinct levels of granularity for attribution. One is for SKAN and the other for everything else. The reporting structure for SKAN attribution is at the campaign level.
For the following campaigns, the reporting hierarchy is the same because the cost is reported. You must combine the data at the appropriate granularity level depending on your aim and what you're attempting to optimize.
You may occasionally need to store the same data twice and use it in different ways. Additionally, you must keep making these improvements if you're working with additional partners. As you may have already realized, this is not an easy task.
The data's accuracy
The effective Cost Per Install (eCPI) and ROAS are not entirely true in the new context. Furthermore, it's challenging to optimize campaigns or provide new resources to channels without precise monitoring of these metrics.
The issue is that overlapping installs between SKAN and the non-SKAN attribution methods lead these numbers to differ from reality. Additionally, no SKAN differentiation is included in the cost report (a campaign is a campaign).
As a result, you see one figure while looking at SKAN attribution reports and another when looking at non-SKAN attribution reports. How can you decide which to believe? Here, there is no secret technique. Additionally, it has significant consequences because ROAS and eCPI are important KPIs.
Ways to deal with these problems
There are several ways to solve the data problem, each with its advantages and disadvantages.
Way 1: Do it manually
You can get a report from the ad network dashboard each time you optimize a campaign and carry out the matching on your own in a spreadsheet.
PROS
1. An affordable option.
2. Anyone can complete it.
CONS
1. Manual labor requires time. According to research, repeated tasks take up a third of the time spent by an ordinary marketer.
2. Data accuracy is always a concern because human labor is frequently error-prone. Making the incorrect decisions based on the incorrect data leads to inaccurate data.
Way 2: Do it programmatically
Another approach is to create the connection to the partner APIs on your own, then connect it using your attribution information.
PROS
1. Helps you avoid manual labor.
2. Enables scaling as your marketing efforts increase.
3. Because you control everything, it is the most flexible choice and better suited for large teams. With this approach, you may choose when to pull the data, its level of granularity, format, attribution matching, and other factors.
CONS
1. With this choice, you are distracted from your marketing duties. As opposed to that, you're concentrating on creating a data aggregation solution that isn't your primary emphasis.
2. High price. It takes a lot of resources to create and manage API interfaces with ad networks. The cost of the cloud and the team of engineers required to support this system will be your responsibility.
3. The data is intricate, and it takes time to understand it. For instance, all of your cost and attribution matchings may become invalid if the name of a campaign changes. To provide the best level of accuracy, your system must support this situation in addition to a number of others.
4. Last but not least, you should wait to introduce new partners until their integration is finished.
Way 3: Do it by using a cost aggregation tool
Utilizing third-party software to automatically collect your costs and correlate them to attribution in your own BI system is an alternative strategy.
PROS
1. Saves manual labor.
2. Moassive scalable.
3. Software for cost aggregating is very specialized.
4. Your needs are probably met when you're ready to introduce fresh companions.
CONS
1. It isn't your primary area of business.
2. Complexity. Making ensuring that the data is coming from two different sources (cost and attribution), planning the data ingestion into your BI correctly, and managing the various data granularity levels are all necessary.
3. Cost-intensive. In addition to the cloud fee assigned for managing the data on your BI, this option requires you to pay an attribution vendor and a cost aggregation vendor.
How about my eCPI and ROAS?
You cannot independently deduplicate the SKAN and non-SKAN install data for your ROAS and eCPI. The ad network cannot do either. When using any of the aforementioned choices, your eCPI and ROAS will remain incorrect until your attribution partner takes care of that for you.
The SKAN data is anonymised, which is why only the attribution information and conversion value are included in the postback that marketers receive from Apple. In other words, Apple's privacy-preserving mechanisms, such as randomized delays in firing the postback, make it impossible to associate the postback with a single user.
Because of this, it is impossible to tell if the same event was assigned to more than one type of attribution.
Together, cost and attribution perform better.
Your MMP is an additional remedy. You can obtain cost and attribution data using the same platform if your attribution partner aggregates cost. If so, your attribution partner can handle comparing SKAN-based attribution methods to non-SKAN-based attribution methods while matching it to cost.
Returning to Network A now In this case, for non-SKAN, you would receive cost information at the campaign, adset, ad, nation, and channel levels instead of only the campaign level. Your attribution partner in this instance connects the cost data at the appropriate level of granularity based on your aims, whether they be SKAN or non-SKAN.
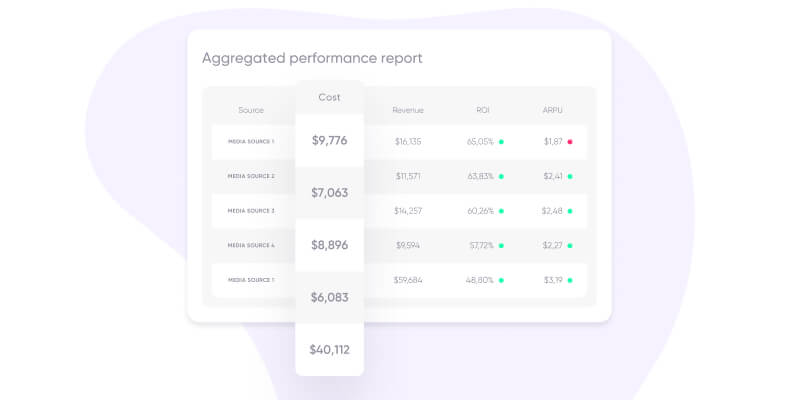
That is precisely what Xpend from AppsFlyer does. You can view your cost with the analytical dashboards and/or pull the cost connected to attribution data directly to your internal BI system via Cost ETL instead of focusing on developing a complex system, pulling the data manually, or matching it to attribution.
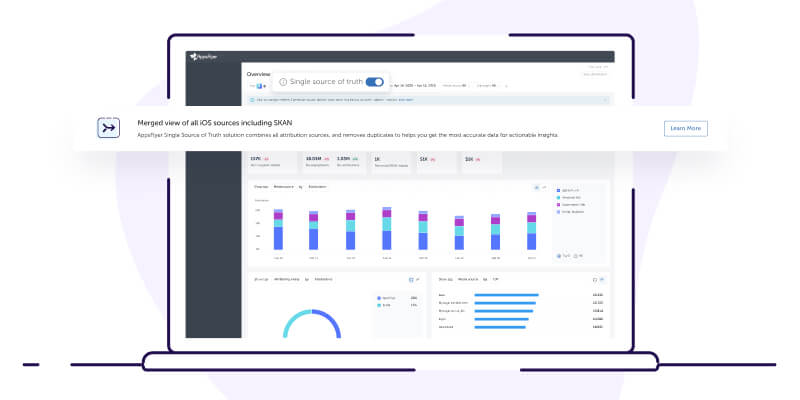
Perhaps you're thinking. Okay, but how can I collect accurate ROAS data and deduplicate installs? The Single Source of Truth (SSOT) solution from AppsFlyer, which was just released, enables marketers to deduplicate overlapping installs.
The fact that up to 35% of installs may be recorded twice based on our data just serves to highlight how unreliable your marketing measurement is. The only thing left to do is to begin studying the data in the appropriate context because Xpend offers the varied granularity of SKAN cost.
As a result, you can now see the right number of installs alongside your cost, ROAS, and eCPI if you are viewing the SKAN, organic, or non-SKAN metrics. Making judgments based on the most accurate data will allow you to concentrate on optimizing your business rather than becoming overwhelmed by the data.
Summary
As we have shown, it is challenging to measure ROAS and eCPI on iOS 14.5+ for the following reasons:
1. Data fragmentation across ad networks and attribution using SKAN versus non-SKAN
2. Inexact cost information
There are numerous methods for resolving these issues, but it is advised to rely on a single platform to provide you the most precise data at the most precise level—and at the appropriate moment.
Empower your team with our App Marketing Intelligence
Free forever. Cancel anytime.