As we all know, data analysis is a part of digital marketing that cannot be avoided. Data, as an important reference for marketers to make decisions, can not only reflect the effect of the work done in the past during app promotion but also guide us to take more scientific and reasonable strategies in the future.
Nevertheless, data from mobile app marketing campaigns requires complicated analysis. One incorrect number can cause the entire campaign to be interpreted incorrectly. In this situation, a number of problems come up, including how to get good data for analysis. What can be done to increase the transparency of the analytics process? How can campaign or app concerns be accurately measured using metrics?

The benefits of marketing analytics
The analysis of data for marketing purposes is known as "marketing analytics." Businesses are able to better understand what motivates consumer behavior, hone their marketing strategies, and maximize their return on investment by applying technology and analytical procedures to marketing-related data.
With analytics, you can answer questions like these:
- How well are our marketing efforts doing right now? What about over the long term? How can we make them better?
- How do our marketing initiatives stack up against those of our rivals? Where do they invest their marketing budget? Do they utilize any routes that we don't?
- Next, what should we do? Are our marketing resources being used effectively? Are we investing our time and resources in the appropriate areas? How should we arrange our investments in a particular time frame?
What are the quality data analysis principles?
However, it is simple to be duped by the results of your own marketing campaigns. Any marketing metric is merely a set of numbers; without context, they are meaningless. You need to be aware of the proper approach to data analytics if you want to prevent frequent blunders while working with data.
How can you appropriately analyze data while avoiding pitfalls? Here are some recommendations:
- Relevance: it's important to know precisely what we are analyzing. Does it make sense, for instance, to compare the nations we are comparing? For example, Tier 1 nations (such as the United States, Australia, and Great Britain) and Tier 3 countries (which include Cuba, Africa, and Korea, among others), have varying quality of traffic, so the data on them may vary greatly.
- Seasonality: a prevalent idea in mobile marketing. We must always be aware of the time spans over which we are comparing the data. We must take into account the data's correlation with one another throughout a specific time period in order to obtain an objective outcome. Seasonality suggests that, for instance, data from December 2019 and December 2020 should be compared. Similar trends can be seen throughout the month and even the week. Weekends should be compared to weekends because mobile app usage is so much more prevalent these days.
- Context: partly includes seasonality or other data parameters. Optimization sorts of the campaigns that were analyzed, for instance. Never compare the CPI of an app install campaign to the CPI of a ROAS-optimized campaign. These measures are incredibly flexible. An apple and an avocado are both fruits, and both are green, so this is like comparing them. They differ in their characteristics, nevertheless. When choosing the data for analysis, base analytics on the product's end aim.
Keep in mind that it is preferable to identify the data you will be working with before beginning the study. How to optimize a campaign and what traffic sources to use. Comparing various traffic sources is not always useful because users' content consumption habits vary among them. When compared at first, dissimilar measurements or picking the incorrect key metrics can be deceptive or just plain unhelpful.

How to interpret metrics
A meter is a qualitative or quantitative indication that reflects a certain quality and degree of success of a product. The quantity of installs and audience activity is shown through quantitative measurements. Understanding a single metric's meaning and how it relates to the other metrics is crucial when evaluating data.
Each marketing metric needs to be taken into account for a particular purpose; it makes no sense to analyze all of them at once. Let's separate them into various groups.
Product metrics
Active Users (DAU, WAU, MAU), Revenue, Retention Rate (RR), and Churn Rate are product metrics (CR). They provide a broad overview of the situation, including the number of users, their preferences, payment information, and the percentage of people that uninstall the app. However, we are unable to use these analytics to make specific marketing choices or to assess the effects of product modifications. The volume, not the bulk, of an app is what matters most when developing it.
The criteria determining the product's financial success and its value to the user include lifetime value (LTV), average revenue per user (ARPU), customer acquisition cost (CAC), and return on investment (ROI).
Marketing metrics
The key performance indicators for marketers include Cost Per Mille (CPM), Cost Per Install (CPI), Click Through Rate (CTR), Install Rate (IR), Engagement Rate (ER), Cost Per Action (CPA), Conversion Rate (CR), and Return on Advertising Spend (ROAS). CTR, IR, and CR are particularly significant since they enable us to assess the effectiveness of our work on the product and demonstrate the caliber of the traffic we have acquired.
When we learn that an outlier in a statistic was not caused by our campaign but rather by issues with the product, we work with the client's team to identify precisely what changes were made to the app that caused this departure. Any changes are possible. For instance, the localization system had a flaw that prevented certain users from enjoying the app's error-filled native-language captions. This may result in both user attrition and reluctance to subscribe.
The issue might be concealed on the app's Google Play or App Store pages if we observe a decline in data at the very top of the marketing funnel, even before an install. Perhaps the app store's screenshots have been altered, making the product page less enticing for users to convert (make an install, purchase, etc.).
There may also be instances where the funnel's initial metrics are OK but the conversion rate from install to purchase declines. We would come to the conclusion that there had most likely been an error in our campaign, such as starting to purchase non-target people or changing the monetisation strategy, such as replacing Paywall or Special Offer.
There are a lot of choices. But it is crucial to be able to appropriately "read" the data. The ongoing data interchange between a marketing firm (or marketing department) and a product team is another crucial thing to remember.
How to organize analytics
Setting a clear aim before beginning a performance campaign analysis is crucial. What specific problem are you hoping to address? It's time to strategize when the goal has been established.
Here are a few typical methods for analyzing marketing campaigns:
- Comparison of various time periods;
- An analysis of how a given statistic has changed through time;
- Monitoring unexpected deviations in metrics throughout the campaign as we move from general to specific, we analyze the campaign for metrics deviations.
Keep in mind how one statistic relates to others as you implement the chosen plan. Let's say that the CR decreased significantly from trial to subscription. We examine potential causes of this drop and start breaking down the available data into more manageable parts. Our measurements are divided by GEO, weekdays, and time. The issue is then identified utilizing the metrics with deviations; perhaps we choose the incorrect audience to target or the incorrect UA strategy. Or perhaps the app itself is the source of the issue.
From our experience, we have gathered a number of guidelines that help us organize transparent, high-quality data analytics:
- Benchmark Benchmarks are requested before initiating a performance campaign. This enables us to compare the effectiveness of our campaign to prior measures.
- Collecting complete information You must have all the information in the overall scheme of the data in order for the analysis to be objective. Which traffic sources are the stats we're using? Which nations? have varieties of optimization? the volume of traffic? Whether we are looking at metrics from TikTok or Google Ads, whether this traffic is coming from the USA or India, whether the campaign was optimized for installs or for conversions, and whether we are collecting data from 100 people or from 1 million, all make a significant difference. Another common scenario is when we are given a target CPI range of $3 to $10. It is important to understand the factors that contribute to this spread because it affects the cost per install significantly. It frequently turns out that the CPI might range between $3 and $10 depending on the sort of campaign optimization. This is regarded as inaccurate information because each sort of optimization ought to have a different cost.
- Clarifying the correctness of the data Let's say a product team gives us a list of metrics, including IR, CPI, CR, and CPA. We now have four metrics, but as long as we do not know what traffic sources they are derived from, they are largely meaningless to us. For example, each of these platforms - Facebook, TikTok, Snapchat, and Google Ads - has unique features. As a result, if we conduct a Facebook campaign, we must take into account benchmarks from that specific traffic source. The same applies to nations: if we launch a US campaign, we should not use global data as a comparison.
Conclusion
High-quality, pertinent data is the foundation of marketing analytics. The KPIs in reports, decisions regarding how to continue to guide the campaign, and the amount of money the project will ultimately raise depend on how accurate and comprehensive the information that has been gathered is. Poor data processing is the main cause of time and financial losses for the customer and marketing agency.
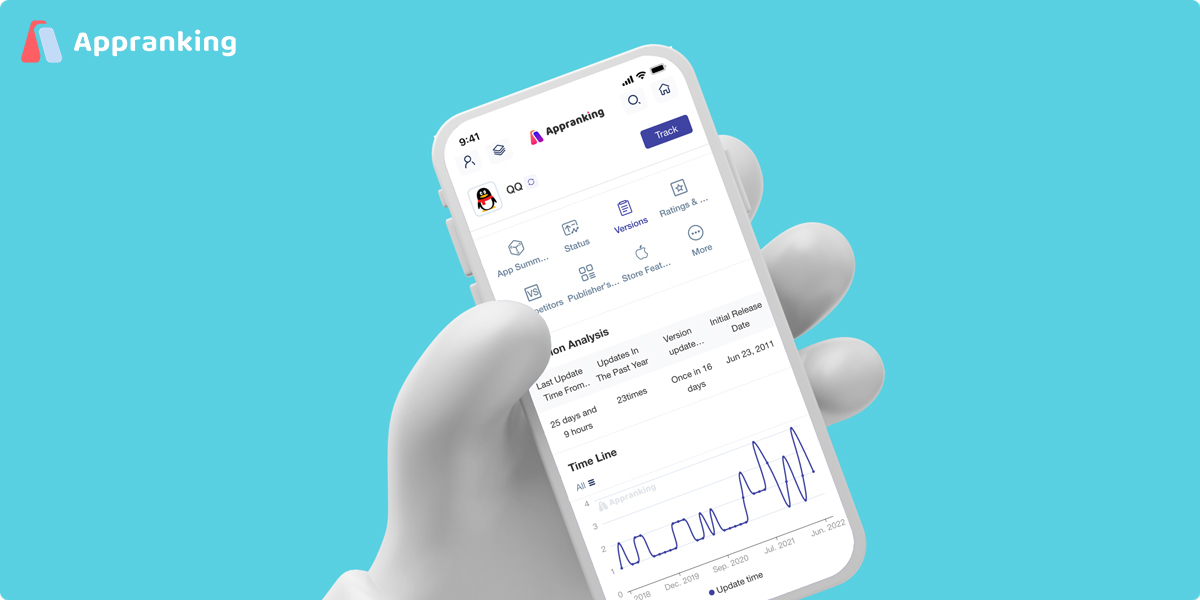
If you need a simple but clear data dashboard to build reliable data analytics, you can use our AppAds and Apranking for authentic and stable data, which can give you professional suggestions.
Empower your team with our App Marketing Intelligence
Free forever. Cancel anytime.


